banner


icon


Alumni Home
In the News
Events
Math Fun
Connect
Donate
Math Home


Math Fun
Archives
Please feel free to add to our Math Fun content by emailing your contributions to alumni@math.utoronto.ca
November 2009
Puzzles

Puzzle 1:

Take 9 from 6, 10 from 9, 50 from 40 and leave 6

Puzzle 2:

The Man at St. Ives
This is one of the oldest riddles in history

As I was going to St. Ives
I met a man with seven wives.
Each wife had seven sacks,
Each sack had seven cats,
Each cat had seven kits;
Kits, cats, sacks and wives,
How many were going to St. Ives?

Puzzle 3:

A man was walking down a country lane with a baket of apples. He met a little girl and gave her half the apples, plus another half apple, then continued on his way. A while later, he met another little girl and gave her half the remaining apples, plus half of another one, and continued on his trip.

Further down the road, he came accross another little girl and gave her half the remaining apples, plus another hlf. Now his basket was empty.

How many apples did he start out with?

Note: No apples were cut during this trip

Puzzle 4:

What is wrong with the following proof?

  • Let a = b
  • Then  (IMAGE)
  • So (IMAGE)
  • And  (IMAGE) ,
  • Then (IMAGE) ,
  • And  (IMAGE) .
  • So, this can be written as  (IMAGE) ,
  • and cancelling the  (IMAGE) from both sides gives
  • Answer: 1 = 2


(Solutions will be posted next month)

Return to Top

Images
*the image this month comes from the AMS Calendar of Mathematical Imagery 2008 found here, no copyright infrigement was intended

symmetry

“Symmetry Energy Image II,” by Rob Scharein, Centre for Experimental and Constructive Mathematics, Simon Fraser University, B.C., Canada

This example illustrates the SE rendering mode in KnotPlot, which visualizes the symmetric energy distribution. KnotPlot is a program to visualize and manipulate mathematical knots in three and four dimensions, and the website includes a wealth of resources and pictures. This picture is a direct screen capture from KnotPlot, rendered entirely in OpenGL, an environment for portable, interactive graphics applications.

Return to Top

Cartoons
*the cartoon this month comes from the website XKCD, no copyright infrigement was intended

purity

Return to Top

Links

Return to Top


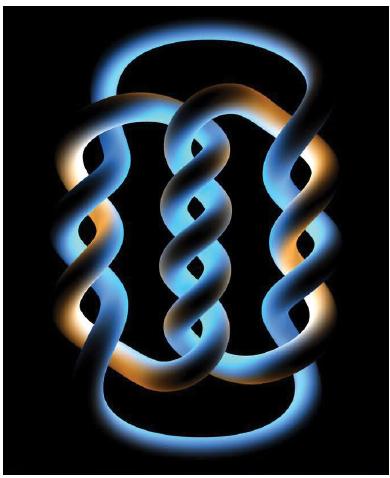
Department of Mathematics, University of Toronto,
Room 6290, 40 St. George Street
Toronto, Ontario, Canada M5S 2E4
Telephone: (416) 978-3323, Fax: (416) 978-4107
Copyright © 2000-2009 Department of Mathematics, University of Toronto.
Comments about this page are welcome and can be directed to
webmaster@math.toronto.edu